 Nox
NoxSee your progress, not just your to-do list
Charts built from the hours you log show how your days and weeks really went, and where your time goes.
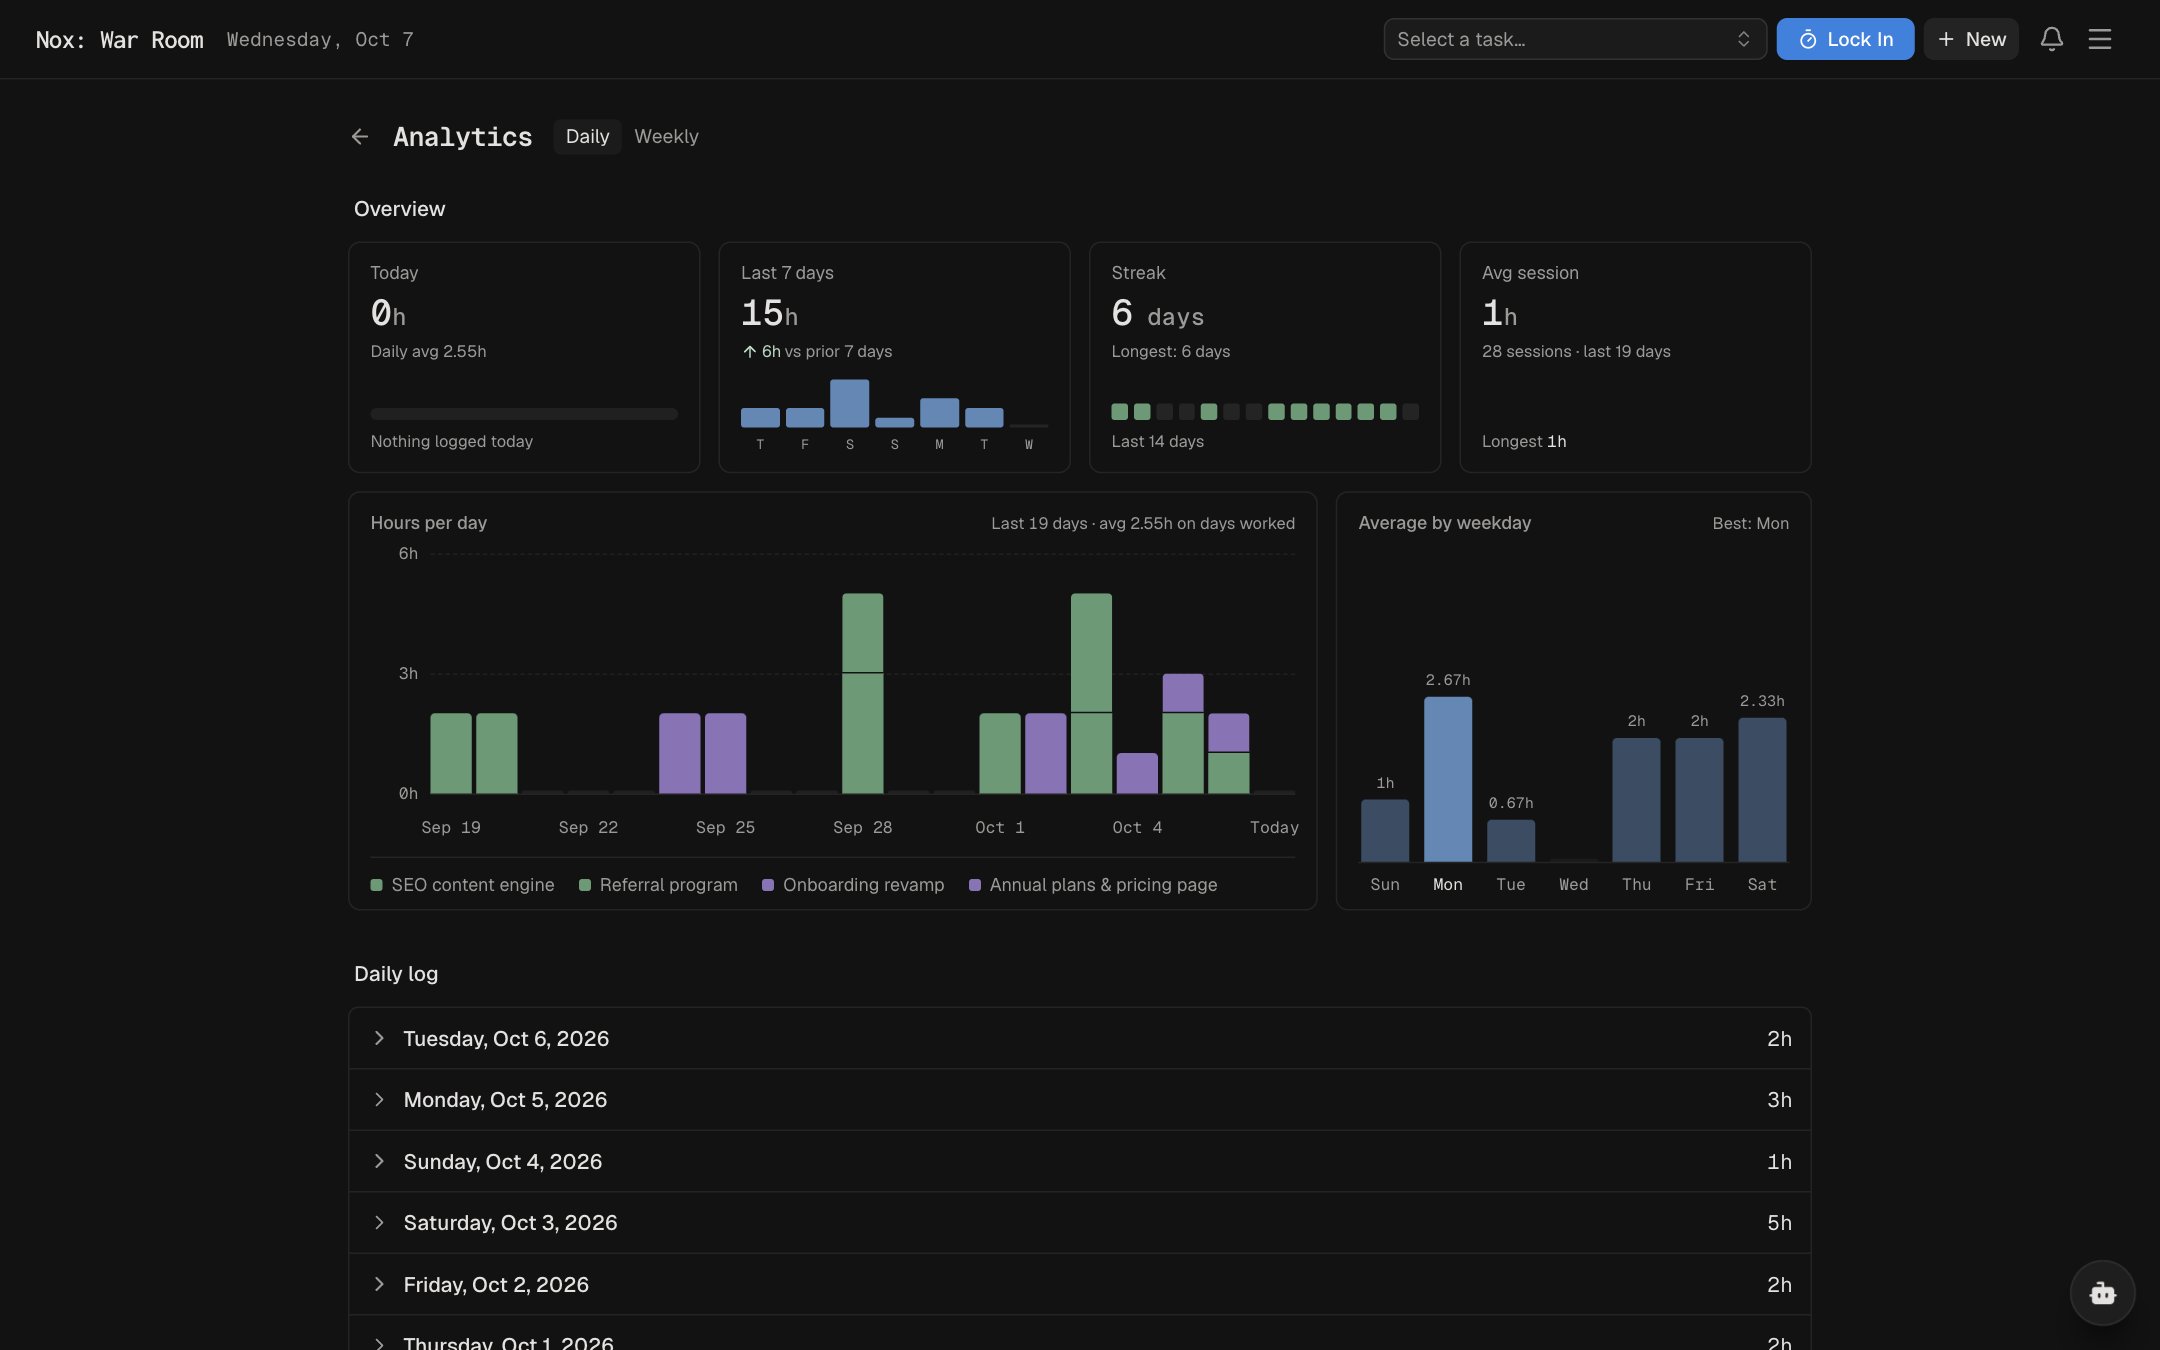
Daily overview
Hours per day and how today compares with your usual weekday.
Weekly report
Planned versus unplanned work, and tasks done versus tasks added.
Spot patterns
Find the days you do your best work and plan around them.
How analytics works in Nox
Nox analytics turns the hours you log and the tasks you finish into daily and weekly charts, so you can see how your time is really spent without keeping a spreadsheet.
- Work as usualHours come from your Lock In sessions, so there's nothing extra to fill in.
- Check your dayThe Daily tab shows today, the last 7 days, your streak and your average session.
- Review your weeksThe Weekly tab shows a 4-week overview, then every week's breakdown on expand.
Today
5.5hStreak
12 daysAvg session
52mLast 7 days
Analytics FAQ
What does Nox analytics show?
The Daily tab shows today's hours, the last 7 days, your streak, your average session and your hours by weekday. The Weekly tab shows hours per week and tasks done versus added.
Where does the data come from?
From the hours logged by your Lock In sessions and the tasks you finish. There's nothing extra to fill in.
What is the weekly report?
A 4-week overview, then every week's breakdown on expand: where the time went, what you finished and what was added.
Can I see which days I work best?
Yes. Hours by weekday show your average for each day of the week, so you can plan your hardest work around your best days.
Do I need to log anything by hand?
No. Hours are logged when Lock In sessions end, and you can edit any session from its task if you need to correct it.
Is analytics free?
Yes. Every feature in Nox, including analytics, is free during the private beta.